Time-of-arrival lightning location systems, using low-frequency and high-frequency detection systems, have been described and utilized by many researchers [Cummins et al.; Smith et al., 1999; Rison et al., 1999]. Limits on the accuracy and precision of such systems depend fundamentally upon the accuracy and precision of the absolute timing source or sources that are used to time tag events at each station. Based on instrumental tests, the LASA 2 us timing uncertainty corresponds to an optimal location uncertainty of 600 m.
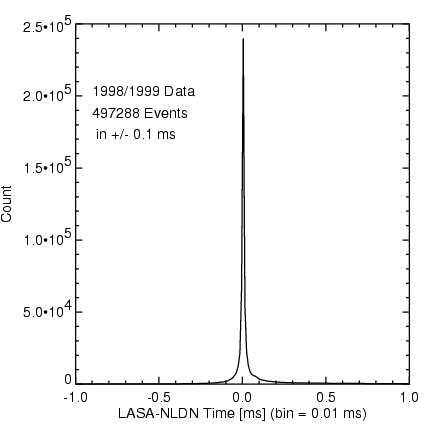
To evaluate the location accuracy of the sferic array we compared LASA event locations to lightning locations determined by the National Lightning Detection Network (NLDN) for Apr.-Sep. 1998 and May-Oct. 1999. The LASA/NLDN comparison was begun by identifying all 1998 and 1999 temporal coincidences between the two data sets within a +/- 20 ms window. Fig 5 shows the LASA/NLDN time coincidence histogram over a range of +/- 1 ms with a bin size of 10 us. The peak is well defined, with a half width of 7 us (determined separately with finer binning).
Based on Fig 5, the time coincidence window for the location analysis was selected to be +/- 100 us. The number of events within this window was 497,288. The number within the original +/- 20 ms window was 813,064. The cumulative distribution of spatial separations between the LASA and NLDN event locations for events within the +/- 100 us coincidence window shows that for the entire 1998/1999 database, 38% of the LASA/NLDN temporal coincidences agree to within 1 km, 85% to within 10 km, 99% to within 40 km, and 99.9% to within 220 km. Further analysis will address only the 1998 data because of the simpler array geometry (the stations nearly formed a square as seen in Fig. 1). The results for the 1998-only database were that 45% of the coincidences agree to within 1 km, 88% to within 10 km, 99% to within 40 km, and 99.9% to within 220 km. From these data alone it does not appear that LASA approaches the theoretical best location accuracy of 600 m.
Location accuracy on an event-by-event basis is addressed in Fig. 6, a log-log plot of the average LASA/ NLDN location difference as a function of range from the NM array centroid. The figure shows that on average the event locations agree to within 1.3 km out to 70 km from the center of the NM array. They agree to within 2.0 km out to a distance of 130 km, a range that corresponds to the edge of the NM array. Beyond this distance the location difference decays somewhat linearly to a range of 1000 km where the mean LASA/NLDN location difference is 25 km.