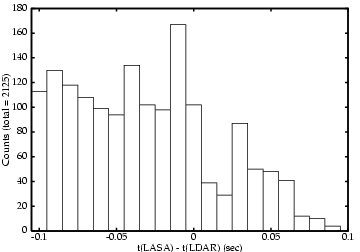
As indicated previously, one reason for the 1999 Florida expansion of LASA was colocation with the Kennedy Space Center LDAR system, using the LDAR system as a ground based VHF system similar to FORTE. Initial comparison of LASA/LDAR observations has been performed on VLF NBE observations from LASA compared with VHF observations from LDAR. As with the NLDN results presented above, the initial step in the analysis was a comparison of the temporal identification of sources, in order to determine that the two systems are indeed observing the same phenomena. The histogram of time differences for over 2000 CIDs observed by LASA compared with LDAR observations is presented in Fig. 7. The LASA/NLDN histogram in Fig. 5 shows a maximum time separation of +/- 1 ms, while the LASA/LDAR histogram in Fig. 7 shows +/- 100 ms. The LDAR system records ~100 VHF events for each LASA event, and based on the histogram, the two systems are not necessarily observing the same phenomena at more than a gross level. The LASA/LDAR histogram indicates that LASA is triggering on the initial burst of VLF radiation associated with CIDs, while LDAR sees that intial radiation followed by more events within 100 ms (possibly intracloud activity associated with the CID).
Taking the LDAR event temporally closest to the LASA NBE event, the height reported by each system is plotted in Fig. 8. The dashed line indicates a perfect agreement between the two systems. The LASA/LDAR CIDs identified for this study are all negative polarity NBEs (NNBEs), and agree with the altitude of FORTE/LASA NNBEs.