Los Alamos National Laboratory

FORTE Compact Intra-cloud Discharge Detection Parameterized by Peak Current


M J Heavner, D. M. Suszcynsky, A. R. Jacobson, B. D. Heavner, and D A Smith

LAUR-02-5759


Peak Current Determination

The Los Alamos Sferic array processing routine determines the peak current for all geolocated events using the Uman-McLain transmission line model (TLM)
[6]. The TLM uses a channel geometry of a circular arc above the earth's surface connected to the surface. Additionally, the return stroke velocity, Vrs, is assumed to be constant. In proposing the TLM, [6] suggest that two models should be used for peak current calculations (the TLM and the `Bruce-Golde' model, which uses a uniform current throughout the channel), and assume that the physical peak current value is between the value given by the models.


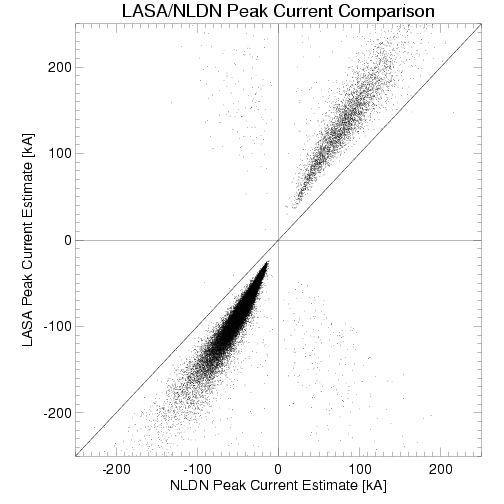
Los Alamos Sferic Array/National Lightning Detection Network Peak Current Comparison

The Uman-McLain transmission line model is used by the National Lightning Detection Network (NLDN) to calculate the peak current assuming Vrs = 1.2 x 10⁸ m/s [1]. The plot shows a comparison between the LASA determined peak current and NLDN reported peak current for coincident CG events. The LASA values are systematically higher than NLDN values. [2] suggests that a higher Vrs (1.8 x 10⁸) should be used. The use of a greater Vrs would improve the peak current agreement for earlier NLDN comparisons [2] as well as the comparison presented here.

LASA/NLDN PKI


Narrow Bipolar Event Peak Currents

The transmission line model is probably not directly applicable to NBs, for two reasons. The intra-cloud nature of CID/NBs invalidates the geometrical assumptions, and the Vrs is probably not correct (5 x 10⁷ m/s may be a more appropriate propagation speed [4]. Despite the above issues, return stroke peak current calculation:

Ipk = - (2 pi epsilon0 c2 D / Vrs) Epk
where D is the distance to the source, and Vrs, is the return stroke velocity) does provide a linear comparison of the relative amplitude of NBs.

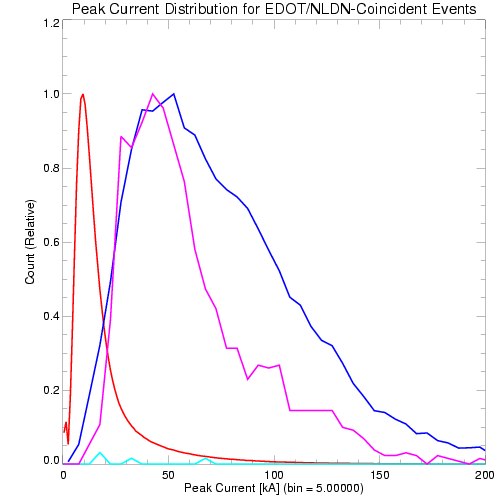
The plot below shows the NLDN peak current in red, the LASA peak current in blue, and the LASA CID/NBE peak current in magenta.

NBE Peak Current Histogram


Links to:
Los Alamos National Laboratory