
The FORTE/LASA coincident events are similar to the GPS/LASA
coincident data set. As illustrated in A below, the coincident
event time window (including the corrections for time of flight
delays), determined independently for the two coincident sets,
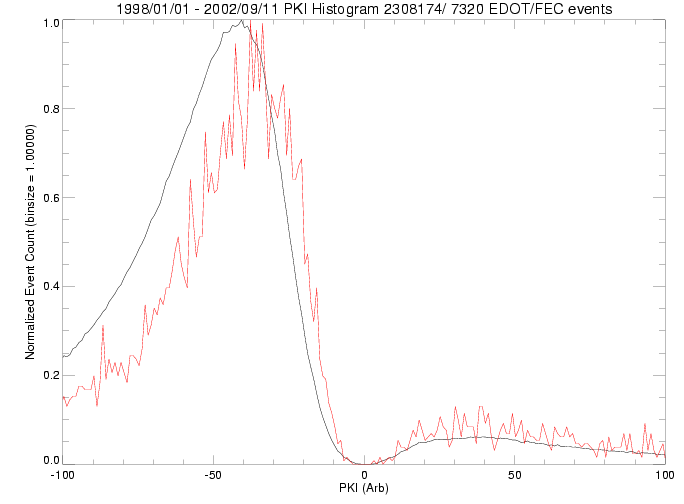
have the same -300 us to +100 us size. Plot B below,
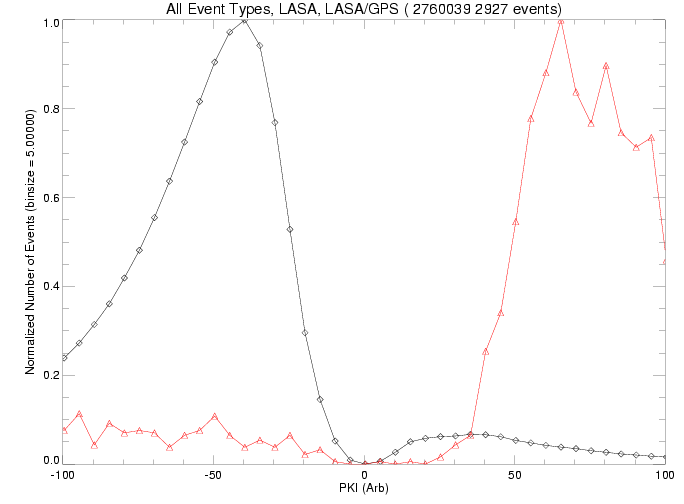
shows the estimated peak current for all LASA events and all
FORTE/LASA events, similar to I above. For FORTE/LASA
coincidents, the results are similar to the general LASA
population, but much more strongly dominated by CGs. The
negative events are slightly skewed towards weaker peak
currents. This is most likely due to the fact that the LASA
population is dominated by -CGs, while the FORTE/LASA population
is dominated by -NBs, for which the peak currents are probably
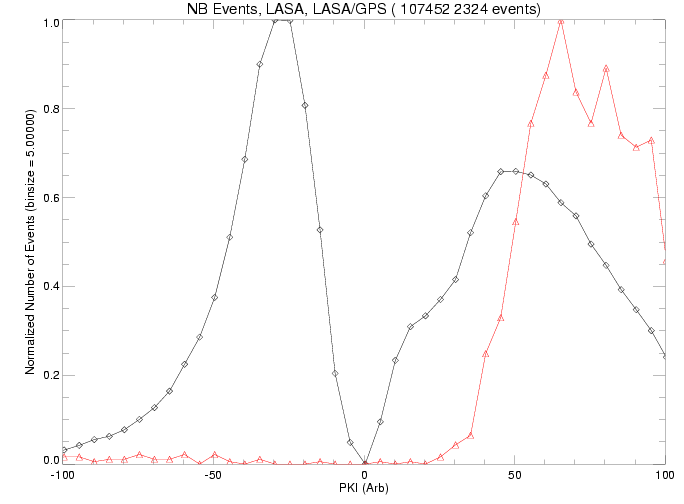
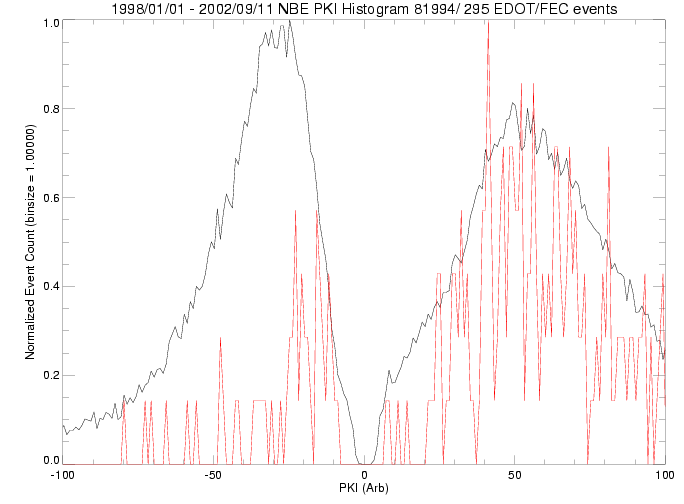
under-estimated. As shown in C, and similar to the GPS/LASA
results in III above, the LASA NBs are nearly equivalent in
total number, while the FORTE/LASA coincident events are more
dominated by +NBs. The +NBs in the FORTE/LASA coincident events
do not show any strong evidence of the estimated peak current
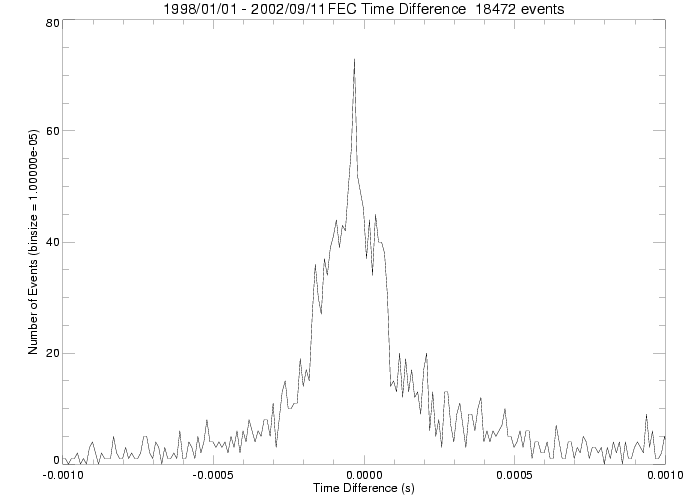
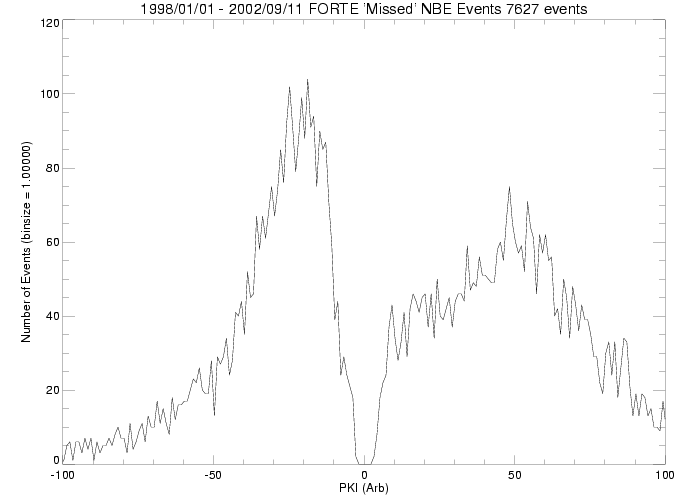
threshold affect seen in III above. Plot D, below, shows the
histogram for all LASA NBEs that occurred when FORTE was
overhead and armed, but for which no coincident FORTE event was
recorded.
B
C
D
GPS Lightning Observations
The GPS observations of lightning were the motivation for the
FORTE/LASA study presented below. The
GPS/LASA time tags for events were compared, and a tight temporal
correlation window provided a strong separation from background
(chance coincident) events. The window used was a GPS time stamp 300
us before to 100 us after the LASA time stamp. For
events
within this window,
the LASA estimated peak current histograms for
all events, independent of LASA classification,
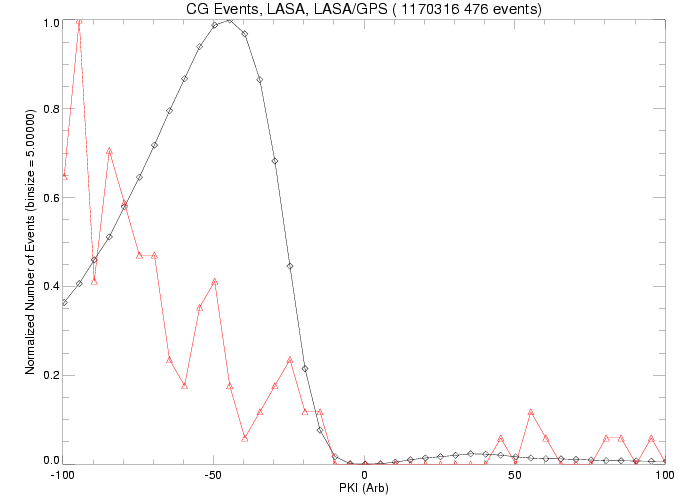
just CG events, and
just CID/NBE events
are shown below.
All LASA events and just GPS/LASA events are plotted.
For all events, -CGs dominate the LASA data set, while the +NBs
dominate the GPS/LASA coincident events.
For just CG events, both LASA and GPS/LASA coincident events are
dominated by -CGs. GPS/LASA events may have an improved detection
efficiency with greater LASA estimated peak
current dependent, but the GPS/LASA CGs have relatively poor statistics.
For the CID/NB events, LASA has an almost equal number of both +NB and
-NB events, while the GPS/LASA NBs are dominated by +NBs. The
GPS/LASA +NBs also show a distinct esimated peak current threshold of ~45.
II
III
FORTE Lightning Observations
Links to: