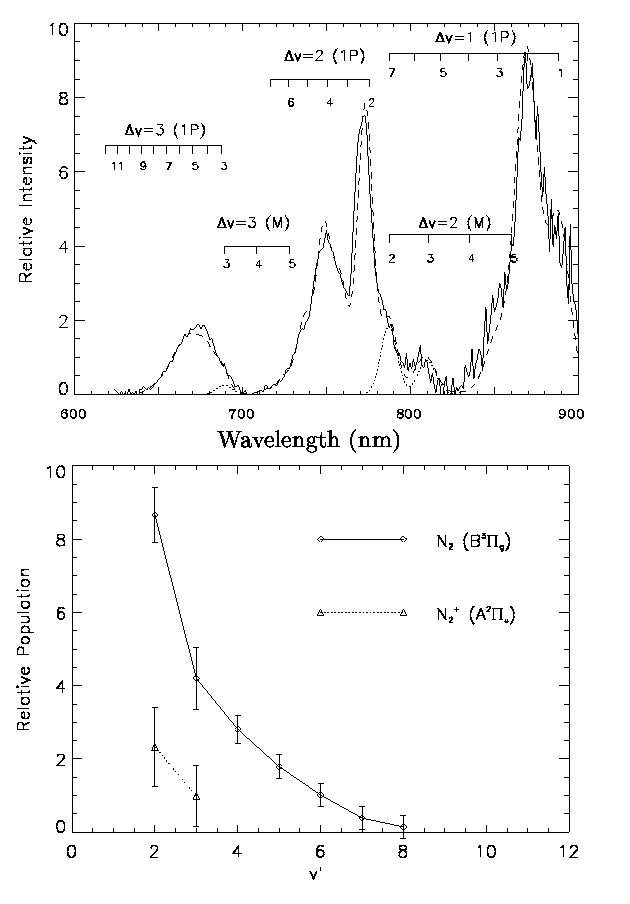
One specific event, from July 24, 1996 at 03:58:23.975 required the inclusion of N2+(Meinel) emission to generate a reasonable synthetic spectral fit to the observed spectrum (Bucsela et al.(1999),Morrill et al.(1998)). The observed spectrum and synthetic spectral fit appear in upper panel of Figure 2. The resulting relative vibrational distribution for the N2(B3PIg) and N2(A3Su+) states are presented in the lower panel of Figure 2. This observation is interesting since the horizontal slit of the spectrograph was measuring sprite emissions from an altitude of 57 km, well below the quenching altitude of N2+(Meinel) (85-90 km). As discussed by (Morrill et al.(1998)) and (Bucsela et al.(1999)), the presence of N2+(Meinel) emission may be due, in part, to energy transfer processes beyond simple quenching. The possible presence of N2+(Meinel) emission in the spectra of (Mende et al.(1995)) and (Hampton et al.(1996)) was also discussed by (Green et al.(1996)). The N2+(Meinel) emission requires at least 16.5 eV to excite the lowest vibration level of the upper state, indicative of higher energetic processes than N2(1PG) emission (requiring only 7.5 eV to excite). Additionally, this event had the strongest signature of blue emissions (as observed using the blue filtered imager, see Figure 2 of (Suszcynsky et al.(1998))). Blue emissions, whether N2(2PG) or N2+(1NG), are indicative of a higher energy process than the red N2(1PG) emissions.
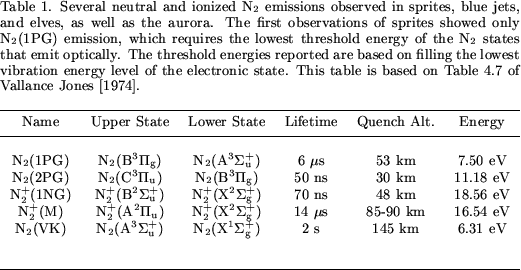
Several molecular nitrogen electronic transitions are summarized in Table 1. The upper and lower electronic states are listed in this table of the emissions. The quenching altitude is the altitude at which 50% of the population of upper electronic state is collisionally deactivated before it undergoes radiative decay (Vallance Jones(1974)). The threshold energy in the table is the energy between the lowest vibrational level of the upper state and the lowest vibrational level of the ground state of N2, although the peak in the electron impact excitation cross-section occurs at slightly higher energy (Vallance Jones(1974)).
A series of recent photometric studies have examined time-resolved blue/NUV emissions. In 1995, (Armstrong et al.(1998)) used a filter centered at 431.7 nm with a FWHM (full width, half maximum) of 10.6 nm. In 1996, a second filter centered at 399.2 nm with a FWHM of 9.6 nm was used in conjunction with the 431.7 nm filter. Both of these filters include both N2+(1NG) and N2(2PG) emissions in their bandpass, making definitive observations regarding ionized emissions from sprites difficult. However, the ratio of the two filtered photometers is able to discriminate between lightning, sprites, and elves. The 399.2/431.7 ratio for lightning is 1, in agreement with the expected continuum radiation. For sprites, the 399.2/431.7 ratio is ~2 while elves alone (based on a lower number of observations) give a measured 399.2/431.7 ratio of ~3. The temporal evolution of the ratio of the two filters suggests an initial process with an electron temperature equivalent to ~10 eV (for less than 1 ms) followed by a longer lasting ~1 eV process. Similar observations were made by (Suszcynsky et al.(1998)) who used a 20 nm wide filter centered on 425 nm with a photometer to observe the 427.8 nm N2+(1NG) (0,1) emission. However, the filter bandpass also included the lower energy N2(2PG)(1,5) emission at 426.8 nm as well as several other less intense N2(2PG) emissions which may have contributed to a portion of the observed signal. A blue filtered camera (response centered at 410 nm with a passband between 350-475 nm) was used in conjunction with the photometer. The important point to note here is that both of these studies indicate the presence of N2+ emissions during the initial portion of the sprite.
The EXL98 campaign used an aircraft to get above the most dense portion of the atmosphere, in order to characterize the blue emissions of sprites. This involved both broad and narrow band video observation as well as NUV/blue spectral observations. The brightest N2+(1NG) emission is at 391.4 nm ((1NG), (0,0) band), but instrumental response, atmospheric transmission, and the close N2(2PG) 389.4 nm and 394.3 nm emissions made the second brightest N2+(1NG) emission at 427.8 nm (1NG, (0,1) band) the target for filtered imaging during EXL98. Knowledge of possible contamination by neutral N2 emission (2PG) through the filter at 426.8 nm is critical in both the filter selection and data analysis. This is especially important for observations at the edge of the image due to the shift of the filter response toward the blue with increased angle.
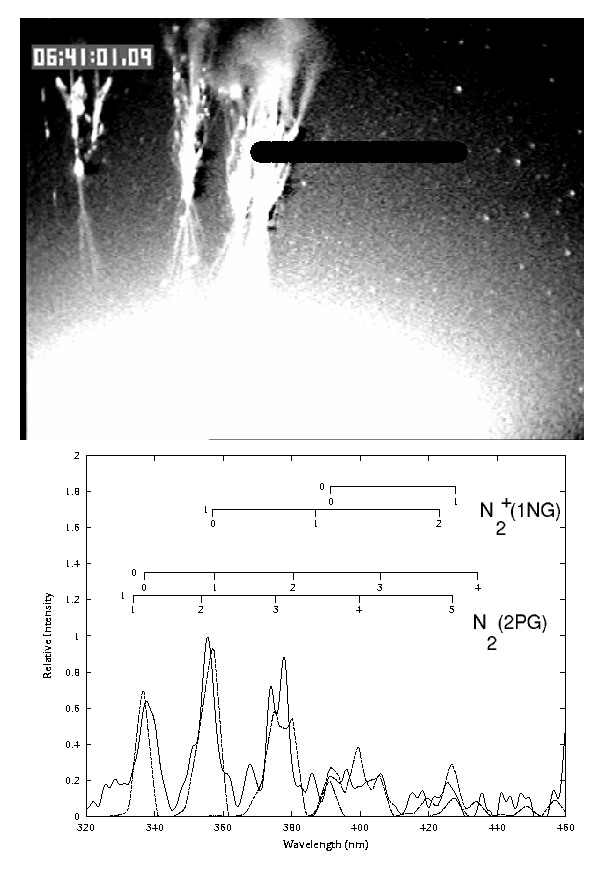
The first NUV/blue spectral observations of sprites were recorded during the mission (Heavner et al.(2000)). The primary blue N2 emissions identified in the observed spectra is the N2(2PG) neutral emission from the N2(C3PIu -> B3PIg) transition. N2+(1NG) emission from the N2+(B2Su+ -> X2Sg+) transition appears but is weak in these spectra. An example of the blue spectral observations from a sprite observed at July 28, 1998 06:41:01.278 is presented in Figure 3. The upper panel is from a panchromatic imager with a 13.7o x 10.0o field of view. The black box indicates the NUV spectrograph field of view defined by the spectrograph entrance slit. The lower panel is the observations from the NUV spectrograph. The observed spectrum is plotted with a solid line, and a synthetic fit to the spectrum including both N2(2PG) and N2+(1NG) is overplotted (see (Bucsela and Sharp(1997)) for a discussion of the fitting technique). The higher energy component (N2+(1NG)) of the synthetic fit is plotted as a separate curve. The observed blue spectrum is from the ``body'' of the sprite, while both color and filtered images of sprites show the majority of blue light is from the lower portions (Sentman et al.(1995b)). There is no signal from the sprite in the 427.8 nm imager in the sprite body, in agreement with the observed spectrum. The sprite occurred at a great circle distance of 329 km from the EXL98 aircraft (flying at ~14 km altitude).
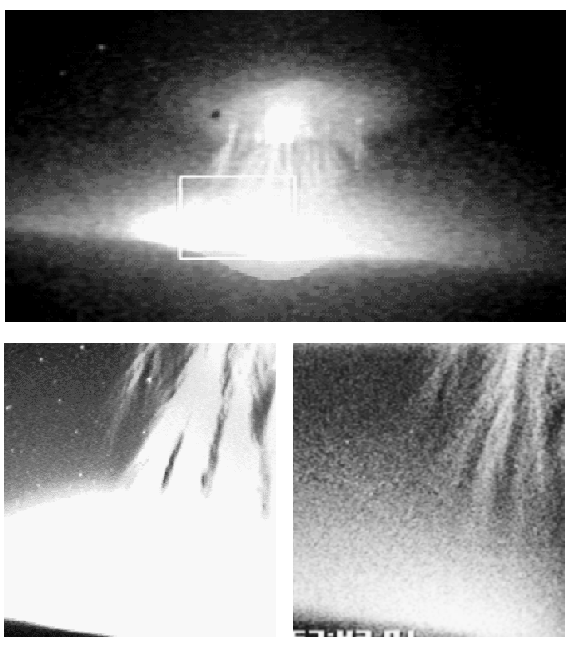
In contrast to the lack of any blue ionized nitrogen signature in the previous example, a second EXL98 observation, from July 24, 1998 04:57:43 is presented in Figure 4 (Heavner et al.(1998)). The upper panel of Figure 4 is an image of the sprite from the wide field-of-view (FOV) camera, with the white square indicating the FOV of the narrow field camera. The lower right panel is the cropped image from the 427.8 nm filtered and the lower left panel is from an identical camera which was not filtered. The 427.8 nm image has been processed with histogram equalization, a method of stretching the dynamic range of the image. The observations of the sprite in the 427.8 nm filtered imager indicates a higher energy process occurring in the tendrils (18.6 eV electrons are required to excite the lowest N2+(1NG) state from the N2 ground state). The post flight calibration of the EXL98 filtered cameras is currently underway. Once complete these results will provide improved estimates of electron energies occurring in the various portions of sprites.
Preliminary estimates of sprite energies can be made from the observed optical emissions. Starting with the 12-60 kJ per sprite reported by Sentman et al.(1995b) the energy per sprite is calculated as outlined in the following discussion. Stellar calibrations were used to determine absolute photon flux measurements of sprites in the UAF 1994 measurements, yielding total optical energies of ~50 kJ per sprite. The 1994 observations were based on color camera measurements with response between 395-700 nm. The observed emissions are primarily from the N2(1PG). Based on the vibrational distributions determined by the spectral fitting and the camera response convolved with the N2(1PG) spectrum, only ~5% of the emissions are detected by the color camera. Matching the observed photon flux in the image of the sprite to the observed spectrum yields a photon spectrum of the sprite. The color camera photon calibration assumed all emissions were centered at the peak response of the red channel, or 650 nm.
This energy flux is used to calculate the total energy deposited in molecular nitrogen and oxygen as follows. Geometrical integration of the stellar calibrations yields a total flux 1.81x10²³ photons per sprite. Because only 5% of the photons emitted from radiating N2(B3PIg) molecules are in the color camera bandpass, there are 3.62x1024 radiating N2(B3PIg) molecules. Assuming that half of the B3PIg state N2 molecules which are excited via electron impact are quenched, the total N2(B3PIg) population is 7.24x1024. For 1 eV excitation energy, the ratio of all N2 electronically excited states to B3PIg electronic state excitation is 3.45 (Slinker and Ali(1982)). This gives 2.5x1025 total N2 electronically excited molecules. Assuming that the upper states all cascade down to the N2(A3Su+) state, each molecule has energy ~6.5 eV. Therefore the total energy stored in electronic excitation is ~26 MJ.
Energy is also distributed amongst vibrationally excited states within the electronic states, so we calculate the vibrational energy similarly. From above, there are 3.62x1024 N2(B3PIg) molecules. The ratio of N2 vibrationally excited states to the N2(B3PIg) state is 2674 for a 1eV electron energy distribution (Slinker and Ali(1982)), so the total number of vibrationally excited states is 1.94x1028. Assuming the average vibrational energy is 0.3 eV (corresponding to N2(A3Su+)(v=1)), there is ~930 MJ of energy in the vibrationally excited N2 states. Combining the vibrational and electronic energy calculated above, we find ~950 MJ deposited in molecular nitrogen by a sprite whose optical energy is 50 kJ. Assuming similar excitation in O2, scale by the relative densities of N2 and O2 for a total energy deposition of 1.2 GJ per sprite in the middle- and upper-atmosphere. Considerations of molecular nitrogen energy transfer processes may decrease the above calculation of energy deposition by a factor of four (200-300 MJ).